The pressure-volume diagram (abbreviated as the PV diagram) is a graphical depiction of pressure variations with respect to volume in a closed system. P-V diagrams can be used to determine a system’s efficiency and the work done by a system or on the system.
The PV diagram is a curve that shows the fluctuation of the volume of material along the X-axis and the variation of pressure along the Y-axis. Each point on a PV diagram corresponds to a different state of the gas. The fundamental thermodynamic processes are isochoric, isobaric, and isothermal processes. A short discussion on all of them is given below. Some of the basic rules to draw a PV diagram are listed below:
- The pressure is shown by the y-axis, while the volume is represented by the x-axis.
- Increasing pressure values increase from bottom to top, whereas increasing volume values increase from left to right.
- The direction of the processes is indicated by an arrow.
Table of Contents
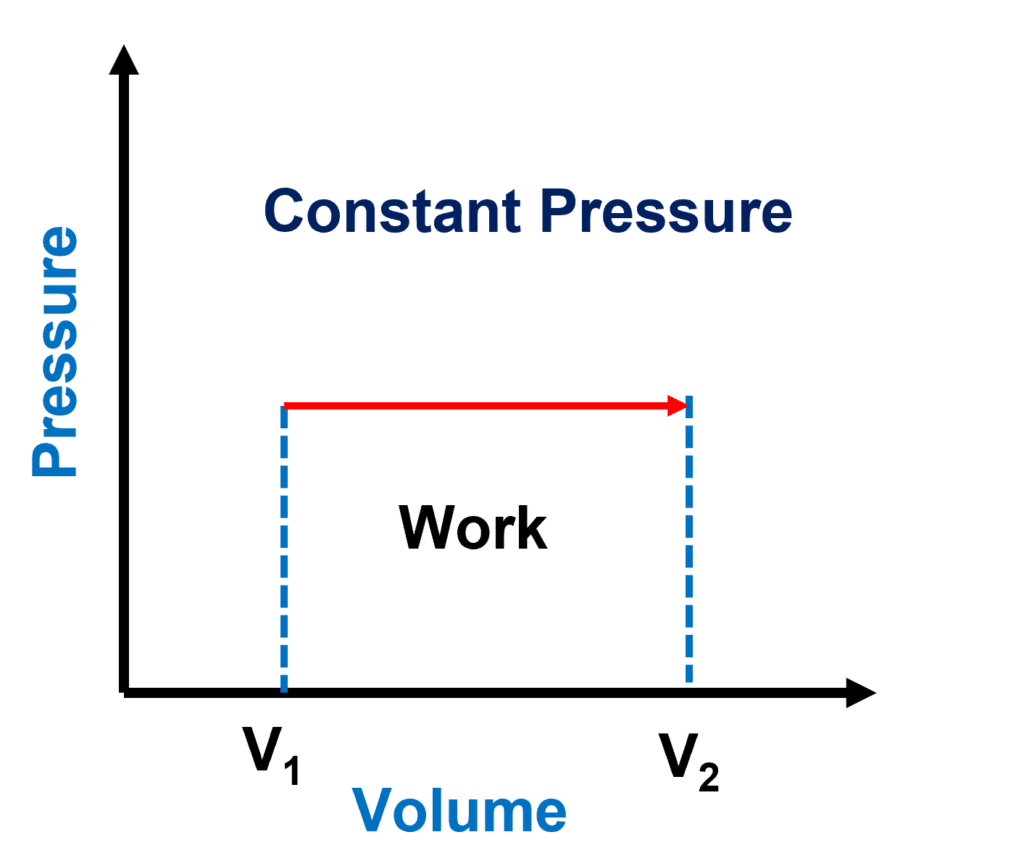
P-V diagram for an isobaric process
The isobaric process is a thermodynamic process that occurs at constant pressure.
The isobaric process is represented by a horizontal line. The region beneath this line reflects the work done. As the volume increases owing to expansion, the gas does the work.
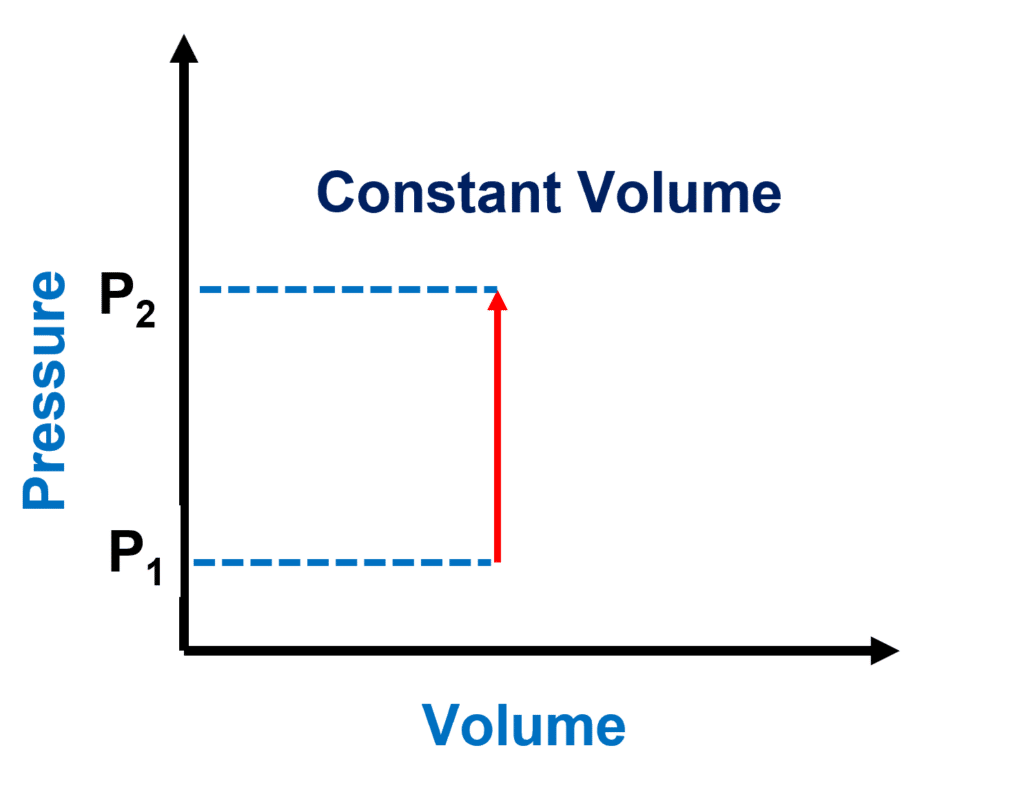
PV Diagram for an Isochoric Process
An isochoric process is a word used in thermodynamics to describe a scenario in which the volume of a system remains constant. The isochoric process is a thermodynamic process that occurs at a constant volume.
The isochoric process is represented as a vertical line. The area under this curve is zero since no work can be done in a constant volume process.
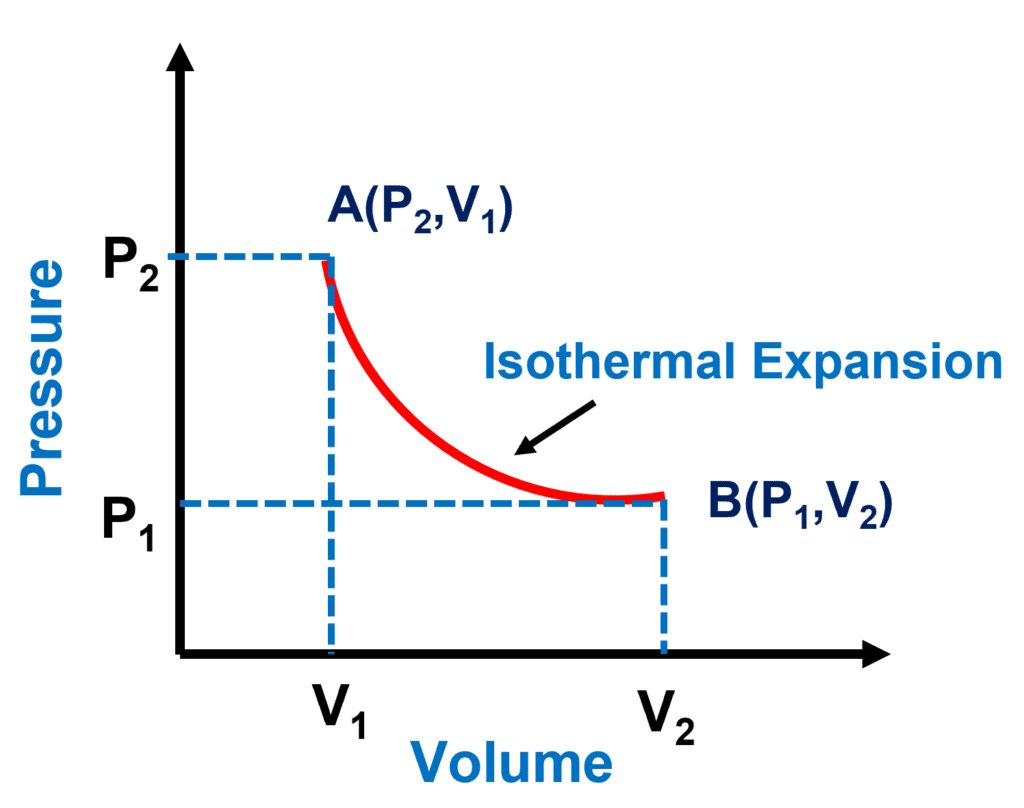
PV Diagram for an Isothermal Process
Isotherm is another name for the pressure-volume graph at a constant temperature. In this process, the internal energy of an ideal gas is just a function of temperature. Because the temperature is constant in an isothermal process, the internal energy is likewise constant.
PV Diagram for the Adiabatic Process
The adiabatic curve is the P-V curve that shows the relationship between pressure and volume of a given amount of gas when the movement of heat into or out of the gas is stopped.
The Thermodynamic Cycle and PV Diagram
P-V diagrams can depict closed thermodynamic cycles that return a system to its original state.
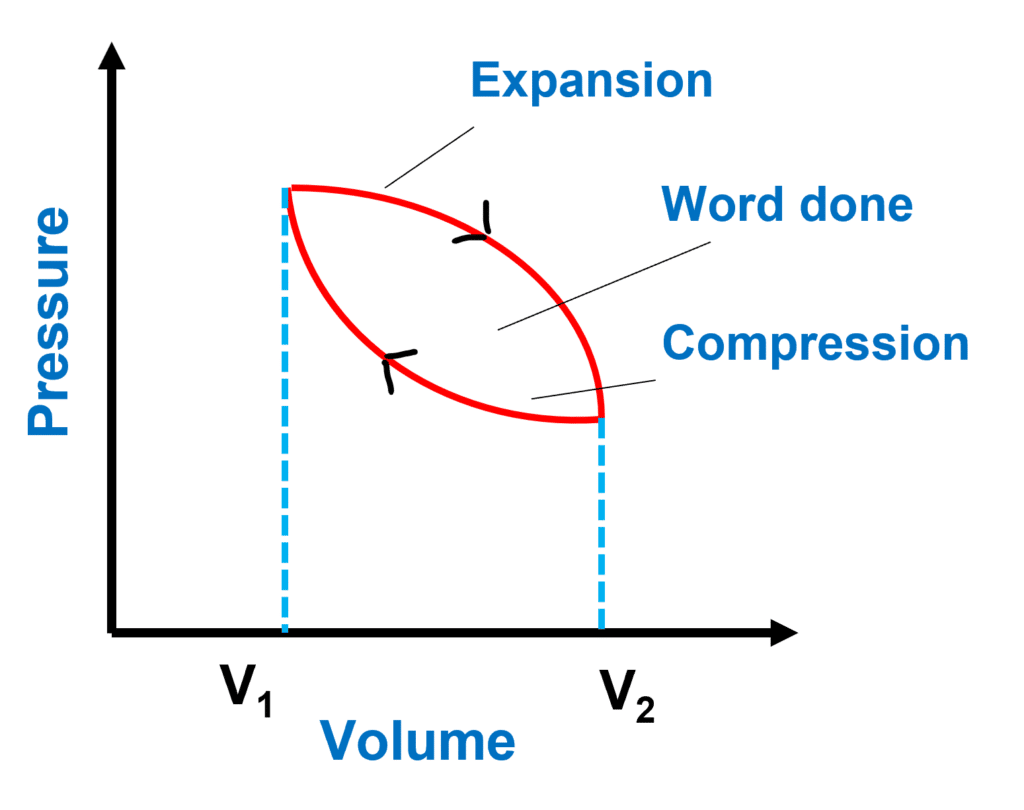
- As the gas expands from high pressure to high volume, the area under the curve represents the work done by the gas.
- The gas is compressed from high volume to high pressure, hence the area under the curve represents the work done on the gas.
The net work done by the gas is positive because the area under the expansion curve is greater than the area under the compression curve, and the area between the curves indicates this.
Area of PV diagram
The product of pressure and volume equals the area of the P-V diagram.
On a p-V diagram, the area under the curve represents the work done throughout the process. This could be calculated by multiplying the areas of a large number of thin rectangles, each of which corresponds to a constant (or nearly constant) pressure (Please refer to the concept of integration).
Summary
A pressure-volume diagram (P-V diagram) is used to depict the relationship between changes in volume and pressure in a system. Thermodynamics, cardiovascular physiology, and respiratory physiology are some of the fields where they are often employed.
Related Links
Frequently Asked Questions
1. What is work done on a PV diagram?
A PV diagram in which both pressure and volume vary. The work done at each interval is equal to the average pressure times the volume change or the area under the curve for that interval. In other words, the entire area under the curve equals the total amount of work done.
2. How do you calculate the efficiency of the thermodynamic cycle using a PV diagram?
The efficiency of a thermodynamic cycle can be calculated using a PV diagram. The efficiency is equal to the work done (area under the curve of the PV diagram) divided by the heat provided as input.
More Links
Static Pressure| Definition, Meaning, and Examples
Heat Engine| Definition, Types, and Efficiency
Density of Oxygen
Pressure Definition and Examples| Science
How Many Water Bottles Equal a Gallon?
Gauge Pressure Formula
Is water a Pure Substance?| Answer

Please send any feedback to [email protected]
- BCl3 Lewis Structure in four simple steps - November 1, 2023
- PH3 Lewis Structure in four simple steps - October 8, 2023
- PF3 Lewis structure in four simple steps - September 24, 2023


