A velocity-time graph depicts the speed and direction an object travels over a certain period of time. Velocity-time graphs are also called speed-time graphs. The vertical axis of a velocity-time graph represents the velocity of the object. The horizontal axis is the time from the start.
Velocity Time Graph
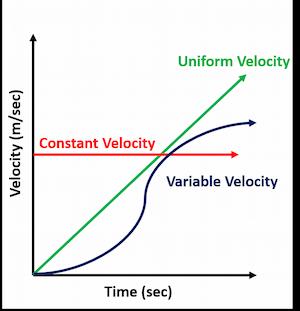
The horizontal axis of the velocity-time graph represents time, while the vertical axis represents an object’s velocity. A velocity-time graph can be used to calculate the distance traveled by an item. There are three different scenarios:
Case 1 (Constant Velocity)
When the body’s velocity increases at a consistent rate, the velocity-time graph has a horizontal straight line (shown in red in the figure). A constant velocity item moves at a constant speed in a constant direction. A constant velocity, in other words, is motion in a straight line at a constant speed.
Case 2 (Uniform velocity)
When the body’s velocity increases at a consistent pace, we get a straight line that rises to the same height for the same amount of time (shown in green in the figure).
Case 3 (Variable Velocity)
The velocity-time graph will be a curve when the velocity is growing at a variable pace (shown in dark purple in the figure).
Table of Contents
Positive Velocity versus Negative Velocity
In the velocity-time graph, when the line is in the positive section of the graph (above the x-axis), the velocity is positive. Similarly, the velocity would be negative anytime the line is in the negative zone (below the x-axis) of the graph.
A positive velocity indicates that the object is traveling in a positive direction, whereas a negative velocity indicates that the object is moving in a negative direction.
Related Links
Can Work Be Negative?
Momentum Equation| Definition And Examples
Linear Acceleration
Instantaneous Velocity
Definition of Work in Physics| Work Formula
Frequently Asked Questions
1. what does the slope of velocity-time graphs represent?
The acceleration is shown by the slope in the velocity-time graph. The slope is defined as the ratio of y-axis change to x-axis change.
2. how to find displacement on a velocity-time graph?
Calculate the total area of the shaded portions between the line and the time axis to find the displacement. The area of both the triangle and the rectangle must be computed and combined together to get the total displacement.
3. What are kinematic equations?
The kinematic equations describe the motion of an object with constant acceleration. These equations are a set of formulas that relate to the five kinematic variables, which are displacement, time interval, initial velocity, final velocity, and constant acceleration.
4. can velocity be negative?
Because velocity is a vector quantity, it can be negative. A positive velocity denotes that the object is traveling in the positive direction as defined by the coordinate system, whereas a negative velocity denotes that the object is moving in the opposite direction. Simply said, when velocity goes negative, it is the speed in the opposite direction.
5. What is constant acceleration?
The term “accelerating” refers to when the speed of an item changes. The rate at which your speed varies, or how quickly your speed changes, is known as acceleration. The speed of an object traveling at constant acceleration varies by the same amount every second.
6. What is Kinetic energy?
- Kinetic energy is defined as the energy possessed by a body by virtue of its motion.
- The translational K.E of a body is equal to one-half the product of its mass, m, and the square of its velocity, v, or (1/2)mv2.
- The rotational K.E of a body is equal to one-half the product of its moment of Inertia, I, and the square of its angular velocity, ω, or (1/2)Iω2.
7. What does the area under the velocity time graph represent?
The distance traveled is shown by the area under the velocity-time graph. The area of a velocity-time graph for a car traveling with uniform acceleration equals the distance traveled during a time interval, and the graph is a straight line.
Important Links
- Difference Between Kinetic and Potential Energy.
- Mechanical Energy| 7 Easy Daily Life Examples
- Room Temperature| Comfortable Temperature
Conclusion
This article explains the velocity-time graph along with different cases.
We hope after reading this article you are able to understand the relationship between velocity and time.
If you have any questions, please feel free to comment or email at [email protected]
Author
Umair Javed
Umair has been working at Whatsinsight since 2020 as a content writer.
He has a Masters degree in Material Science.
More Interesting Topics
Velocity Formula & Definition
Gravitational Potential Energy (w=mgh)
Momentum Equation| Definition and Examples
Centripetal Acceleration| 9- Easy Examples
Kinetic Energy Formula
Relativistic Kinetic Energy
Energy of Light

Please send any feedback to [email protected]
- BCl3 Lewis Structure in four simple steps - November 1, 2023
- PH3 Lewis Structure in four simple steps - October 8, 2023
- PF3 Lewis structure in four simple steps - September 24, 2023


